In this blog, we’ll talk about the Hammer Candlestick pattern in trading. We’ll learn how to use it to understand price movements and technical analysis. By mastering this, we can make more money and reduce our losses in trading.
1. What is a Hammer Candle :
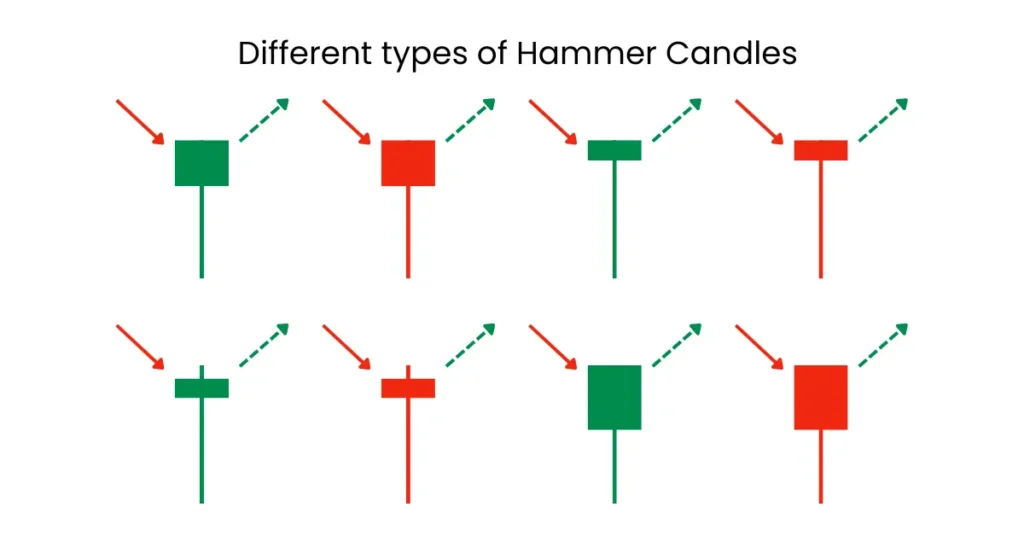
Hammer candlestick is a single candle pattern that is formed in downtrend at support level. It states that market can reverse from this point or market may change the trend. Hammer candle looks like an actual hammer.

The formation of a hammer candlestick suggests that while selling pressure was initially strong, it was ultimately outweighed by buying pressure, hinting at a potential reversal in the price trend. Traders often interpret the hammer candle as a sign of bullish sentiment and a possible change in the direction of the market.
2. How Hammer candle is formed on chart :
After the close of the previous candle, the new candle starts with a downward movement, forming a red body. as time passes, the price moves up and forms a bottom wick. Before closing time of the candle, stock moves up forming a shape like hammer, thats why it is called as Hammer Candlestick or simple hammer candle.
When the market dips to support levels, the dynamics of price action shift, giving rise to various candlestick patterns, including the hammer candle. A hammer candle’s unique structure features an opening price, a session dip, and a reversal with a downward-extending tail at the close.This distinctive shape suggests a potential reversal in the market sentiment, signaling that downward momentum may be weakening and an upward move could be on the horizon.
3. What are the advantages of Hammer Candlestick :
- Hammer candle is a strong bullish confirmation
- If hammer candle formed on support then high probability of trend change.
- Various traders widely use hammer candles as a sign of a reversal candle.
- Hammer candle state that market has rejected from its bottom and there is a high probability of reversal
- If market making multiple rejections from support and seeing like a hammer candle then you can easily exit from selling position or you can enter in a new buying position
4. How to trade Hammer Candlestick :
There are different ways to trade a hammer candles
- When price hits support and a hammer candle forms, it signals a buying opportunity. Traders can buy, setting a stop loss below support for risk management. Aligning profit targets with risk-reward ratios optimizes gains, capitalizing on hammer candle reversals with disciplined risk management.
- In a strong uptrend, if a retracement forms a hammer candle near a round number or recent swing low, it signals a potential buying opportunity. Traders can buy, setting a stop loss below the hammer’s low to manage risk, capitalizing on the reversal indicated by the hammer candlestick.
- If a stock undergoes a sharp decline, followed by small-bodied candles and then a strong hammer candle, it may signal a buying opportunity. This suggests consolidation after the fall, with buyers pushing prices higher. Traders can initiate buy trades, anticipating a potential reversal and upward movement.
5. When to avoid Hammer Candlestick :
- Hammer candles at uptrend peaks are less reliable. They’re better in downtrends or at support levels. Ignore them at tops; focus on bottoms for more reliable signals
- Exercise caution when a hammer candle appears within a consolidation zone. As it doesn’t align with a support level, avoid making trading decisions for better risk-reward ratios.
- When multiple hammer candles form at a support level, it’s prudent to ignore the signals, as this scenario is indicative of a consolidation zone. Consequently, traders should seek out alternative technical or price action patterns to base their trading decisions on.
6. Examples of Hammer Candles on chart :


Pingback: What is Support and Resistance in Stock Market - Nifty Scalper
Pingback: The Doji Candlestick Pattern: - Nifty Scalper