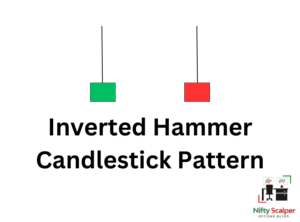
Hammer Candlestick Pattern
The key characteristics of a hammer candle are as follows:
- Small body: The body of the candlestick is relatively small compared to the overall length of the candlestick.
- Long lower shadow: The candlestick has a long lower shadow, which represents the intraday low that was achieved during the session.
- Little to no upper shadow: Ideally, there should be little to no upper shadow, indicating that the price closed near its high for the session.
The formation of a hammer candle suggests that selling pressure was initially strong but was overcome by buying pressure, indicating a potential reversal in the price trend. Traders often interpret the hammer candle as a sign of bullish sentiment and a possible change in the direction of the market.
However, it is important to note that a single hammer candle does not guarantee a trend reversal. Traders usually look for confirmation signals, such as a higher close in the following session or a break above a key resistance level, to confirm the bullish reversal.
As with any trading pattern or signal, it is recommended to consider other factors such as the overall market trend, volume, and additional technical indicators to make well-informed trading decisions.
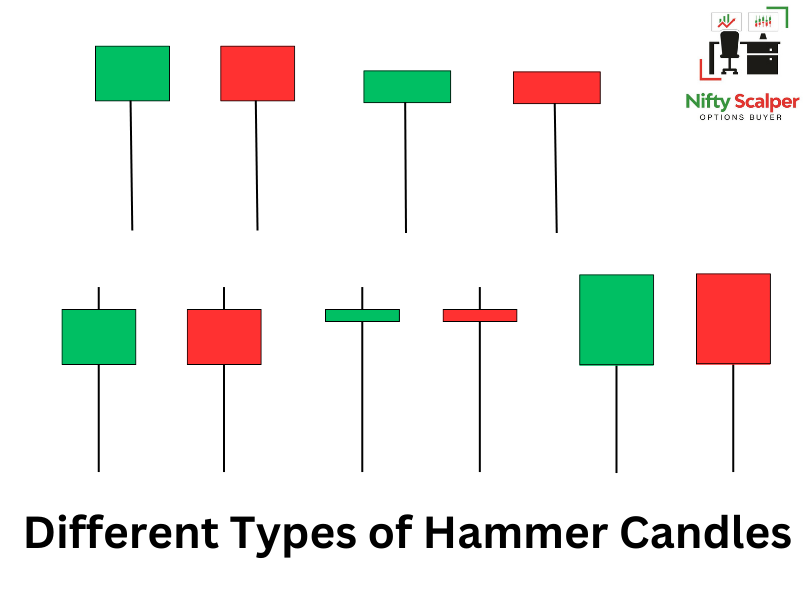
Different types of Hammer candlesticks
How to Trade Hammer Candle
Trading hammer candles involves a combination of identifying the pattern correctly and using additional technical analysis to confirm the potential reversal. Here are some steps to consider when trading hammer candles:
- Identify the hammer candle: Look for a candlestick with a small body and a long lower shadow. The candlestick should preferably have little to no upper shadow, indicating a strong bullish sentiment.
- Confirm the pattern: While a hammer candle can be a bullish reversal signal, it’s crucial to seek confirmation from other technical indicators or patterns. Consider factors such as the overall market trend, support and resistance levels, and volume.
- Look for support levels: Identify nearby support levels that can further strengthen the bullish case. If the hammer candle forms near a significant support level, it adds more weight to the potential reversal.
- Analyze the volume: Evaluate the trading volume accompanying the hammer candle. Higher volume during the hammer formation indicates increased buying interest and reinforces the bullish signal.
- Wait for confirmation: To reduce the risk of false signals, it’s often prudent to wait for confirmation before entering a trade. You can look for confirmation by observing the price action in the following sessions. Ideally, the price should close higher or break above a key resistance level.
- Set stop-loss and take-profit levels: Determine your risk tolerance and set appropriate stop-loss levels below the hammer candle’s low or the nearest support level. Establish a target for taking profits based on your risk-reward ratio and the potential price movement.
- Manage your position: Once you enter a trade, monitor it closely and adjust your stop-loss and take-profit levels as the price progresses. Consider trailing your stop-loss to protect profits if the trade moves in your favor.
- Combine with other strategies: Hammer candles work best when used in conjunction with other technical analysis tools and strategies. Consider using indicators like moving averages, trendlines, or oscillators to strengthen your trading decisions.
Here are few examples of Hammer Candlestick Pattern on Chart:


Remember that trading involves risks, and no trading signal or pattern guarantees success. It’s important to practice proper risk management, conduct thorough analysis, and continually educate yourself to make informed trading decisions.