In this blog, we’ll talk about the Support and Resistance in Stock Market. We’ll learn how to use it to understand price movements and technical analysis. By mastering this, we can make more money and reduce our losses in trading.
Table of Content
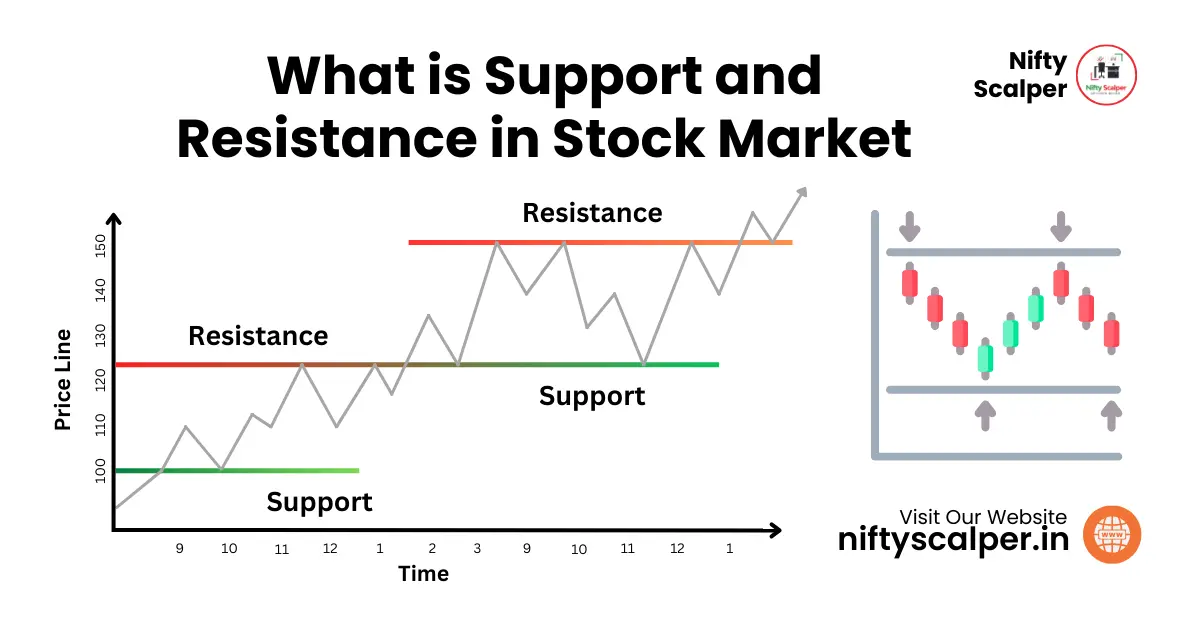
What is Support :
“Support Level is a level from where price start moving upward.” Price reacts and does not falls down. At support stock price tends to move on higher side.
What is Resistance :
“Resistance level is a zone or price level from where price may start falling down.” Price reacts and does not moves up. At resistance stock tends to move on lower side.
How to Identify Support and Resistance Levels :
- Historical Price Data: By looking at price charts of past days traders can note price movement from same levels like bouce back from a level or rejection from a level multiple time. These levels can be stated as Support and Resistance
- Volume Analysis: If you see high volumes near certain levels on chart and rejection of price from same level or bouce from same levels then you can mark that level or zone as Support or Resistance on chart.
- Trendlines: If you draw line connecting multiple highs or multiple lows then you can see price rejection or bouce from the line. You can call the line as support or resistance line.
Significance of Support and Resistance in Stock Market:
- Market Psychology: Support and Resistance level reflects the activity to buyers and sellers at that level. It indicates a crutial area for deciding the movement of stock price.
- Trend Reversals: Breakouts above resistance or breakdowns below support can signal potential trend reversals, offering best trading opportunities.
- Entry and Exit Points: Traders can use support and resistance levels to take entry and exit. Traders can decide Risk Reward based on support and resistance
Types of Support and Resistance in Stock Market :
- Horizontal Support/Resistance: If you see chart on a specific timeframe you will notice that price contineously moving up from a special zone/level or going down from a special level/zone. These level or zone is called as a horizontal Support and Resitance in Stock Market.

- Diagonal Support/Resistance: If you draw a trendline sloping in upward direction and stock moving in upward with taking multiple support from same trendline then you can consider it as a support line. Vice-versa If you draw a trendline slopping downward and stock in downward with taking multiple rejection from same trendline then you can consider it as resistance line.

- Round Number Levels: If you analyze multiple stocks you will notice that some stocks are taking support or resistance as specific levels such as multiple of 10/100/1000, etc. These are called as round number support and resistance. Mostly these round number support and resistance are helpful in Index Trading.
How to Trade on Support and Resistance in Stock Market :
- Bounce Trading: When market is in Range then you can try buying on support and selling on resistance. This is a very good strategy to make money in sideways or range bound market.
- Breakout Trading: When market is trendy then by taking buy position on breakout of resistance can give good result. similarly when market is trendy on downside by taking sell position on support breakdown can give good results in trading.
- Pullback Trading: Waiting for price to retrace back to a previous support or resistance level before entering a trade in the direction of the prevailing trend. This is knows as Retest and Small Stop Loss trading. This is same as Breakout Trading but majour difference is that we take entry on a retest. Here in this cases we have strong confirmation and small SL.
Limitations and Risks :
- False Breakouts: Support and resistance levels may fail to hold, resulting in false breakout signals that can trap unsuspecting traders.
- Market Volatility: Rapid fluctuations in market sentiment or unexpected news events can invalidate established support and resistance levels.
- Overreliance on Indicators: Blindly following support and resistance levels without considering other factors such as fundamental analysis or market context can lead to suboptimal trading decisions.
Conclusion:
Mastery of support and resistance levels is an important skill for any trader seeking to navigate the complexities of the stock market. By understanding the psychology behind these key levels, identifying them with precision, and diploying strategic trading techniques, investors can gain a competitive edge in achieving their financial goals. However, it’s essential to approach support and resistance analysis with a critical mindset, acknowledging their limitations and integrating them into a comprehensive trading strategy that comply with both technical and fundamental factors.
Remember, successful trading is not just about mastering Support and Resistance Levels; it’s about combining them with Risk Management, Discipline, and Continuous Learning to get the best results in the stock market.
Keywords: support and resistance levels, stock market, technical analysis, trading strategies, trend reversal, breakout trading, bounce trading, risk management.